 Minslite veitarataravi ni veivakauqeti me baleta na kena kau laivi na ozone/CO/VOCs
Catalyst activity alone does not determine the actual removal efficiency of a CO catalyst. CO catalytic oxidation is a gas-solid reaction. Koya gona, the gas flow must first transport reactants to the catalyst surface. External and internal diffusion then carry them to active sites. Gas flow distribution directly controls residence time, mass transfer efficiency, and temperature uniformity in the catalyst bed. Public research shows that flow velocities near the walls can drop to 40% of those in the center. Na kena itinitini ., catalyst utilization rates may fall below 60%. A cross-section temperature difference above 30°C, or a pressure drop 30% above the initial value, often signals flow maldistribution, sala, or localized clogging. Kena itinitini, gas flow distribution deserves the same attention as catalyst activity, totolo ni vanua, kei na katakata. It is a core variable in the design, selection, and operation of CO catalytic systems. The numbers cited here are typical magnitudes from published literature and engineering cases. They illustrate trends. Ia, specific projects require validation through CFD simulations, cold-flow tests, and field data.
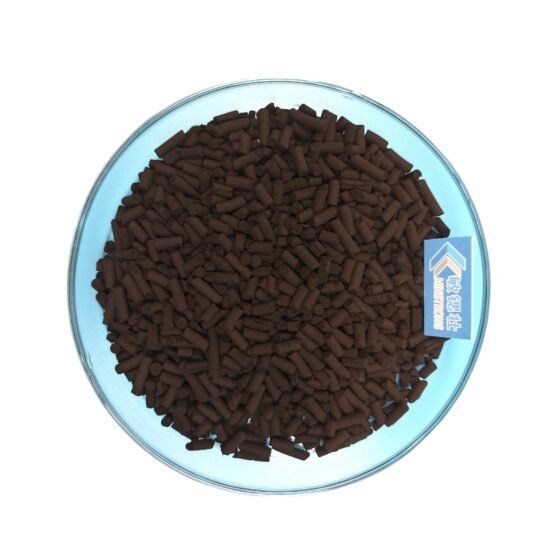
kaboni monokisaiti
How Does Gas Flow Distribution Determine CO Catalyst Performance?
Intrinsic Activity vs. Effective Utilization
Laboratory evaluations typically measure intrinsic catalyst activity under ideal flow and sufficient mass transfer. In a real reactor, ia, effective utilization depends on both intrinsic activity and gas flow distribution quality. These two factors multiply. They do not simply add. Uneven velocity reduces residence time in high-velocity zones. Kena itinitini, CO molecules leave before they fully contact active sites. Low-velocity zones offer longer residence time. Ia, they pass less gas per unit time. Koya gona, a large portion of the catalyst sits idle. A radial-flow fixed-bed model found that uneven gas flow alone can cause about 11% conversion loss. Ikuri ni, a lab-scale CFD simulation with 1 L/min inlet flow showed that wall velocity was only 40% of center velocity. Na kena itinitini ., CO oxidation conversion fluctuated by up to ±8%.
Hotspots and Deactivation Risks
Gas flow distribution also creates safety risks. CO oxidation is highly exothermic. Flow maldistribution concentrates the reaction load in small areas. Vaka kina, hotspots form. Industrial data show that a 60°C rise in catalyst inlet temperature can accelerate deactivation by about 57%. Even when the average bed temperature stays within design range, local hotspots can cause irreversible sintering. Koya gona, gas flow distribution directly affects catalyst lifespan and compliance stability.
What Is Gas Flow Distribution in a CO Catalyst Bed?
Radial and Axial Distribution
Gas flow distribution describes how uniformly gas velocity, totolo ni drodro, and flow direction spread across the catalyst cross-section. Engineers monitor two dimensions. Radial distribution means velocity differences at different locations on the same cross-section. Axial distribution means velocity and concentration changes along the flow direction. In denitrification projects, a relative standard deviation (RSD) below 15% for first-layer inlet velocity often serves as a flow field acceptance benchmark. CO catalytic oxidation differs in reaction system. Ia, the basic requirement for cross-sectional velocity uniformity is similar. When RSD exceeds this level, reaction conditions differ significantly between high-velocity and low-velocity channels.
Why Honeycomb Catalysts Are More Sensitive
Honeycomb catalysts are especially sensitive to gas flow distribution. Honeycomb channels have no lateral mixing. Koya gona, gas flow rate in each channel stays nearly constant along its full length. Once a skewed velocity profile forms at the inlet, CO concentration in high-flow channels drops slowly. Ena kena veibasai ., CO in low-velocity channels depletes quickly. Kena itinitini, the remaining catalyst length becomes ineffective. Oqo “inlet determines outcome” behavior makes inlet flow uniformity a design priority.
How Does Uneven Gas Flow Reduce CO Removal Efficiency?
Uneven gas flow distribution affects CO removal efficiency through three linked pathways.
Residence Time Varies Spatially
High-velocity zones may have less than 60% of design residence time. For mass-transfer-controlled CO oxidation, insufficient residence time directly lowers conversion. Published orthogonal experiments show that at 353 K, increasing volumetric flow rate can drop CO conversion by 39.6%. The increased gas velocity reduces contact time.
Reaction Load Concentrates Spatially
Flow maldistribution concentrates heat release from CO oxidation in localized areas. Under non-isothermal conditions, thermal effects change local density and viscosity. This further worsens existing velocity differences. If wall heat loss occurs, temperature differences between center and wall can drive sustained convection. Na kena itinitini ., this stabilizes the maldistribution pattern.
Deactivation Modes Accelerate
Local high temperatures promote sintering of active components. Ena gauna vata oya, low-velocity stagnation zones tend to accumulate carbon due to higher CO concentrations. Analyses of CO catalyst deactivation in steel flue gas show that carbon deposits and coking form an inert layer on the catalyst surface. This layer blocks reactant access to active sites. When sintering and carbon buildup occur simultaneously at different bed locations, catalyst degradation becomes non-uniform and unpredictable. Kena itinitini, local failure spreads to surrounding areas.
What Causes Uneven Gas Flow in CO Catalyst Systems?
Causes fall into three stages: design, vakavodoki, and operation.
Design Stage
The reactor inlet structure is the first control point. When inlet gas enters a suddenly expanded shell as a jet, the abrupt flow area change causes severe non-uniformity at the distributor inlet. If the inlet elbow lacks guide vanes, downstream maldistribution and reverse vortices form. If these do not dissipate before the catalyst bed, they create velocity skew across the inlet cross-section. Ikuri ni, an excessively high reactor length-to-diameter ratio limits space for self-correction before the gas reaches the catalyst.
Loading Stage
In a fixed bed, spatial variations in bed porosity primarily determine flow velocity distribution. Non-uniform radial packing density of catalyst particles or modules creates permeability differences. These differences form preferential flow paths. Kena ikuri, gaps or misalignments between honeycomb catalyst modules create low-resistance bypasses. Na kena itinitini ., a portion of gas bypasses the effective reaction zone.
Operational Stage
Dust accumulation, pulverization, and thermal aging alter resistance distribution. Local condensation in high-humidity conditions, dust bridging, pressure fluctuations, and catalyst aging all contribute to maldistribution. This process shows positive feedback. Skewed-flow areas accumulate less dust and gain resistance slowly. Ena kena veibasai ., high-velocity zones undergo stronger erosion and generate more debris. Kena itinitini, local resistance distribution becomes more complex.
How Can a CO Catalyst System Improve Airflow Distribution?
Improvements fall into three levels: inlet flow conditioning, cross-sectional flow equalization, and operational control.
Inlet Flow Conditioning
Engineers can install a diverging flow-guiding component at the reactor inlet. This component lets airflow decelerate and diffuse in a controlled way before entering the large-diameter shell. If the guide opening angle is too large, flow separation may occur at the diverging walls. This worsens non-uniformity. Guide vanes at elbows can eliminate secondary flows and skewed velocity vectors from the bend. Koya gona, they ensure a consistent flow direction into the next unit.
Cross-Sectional Flow Equalization
Flow distribution plate design should shift from “uniform perforation” me “graded perforation.” Uniform perforation assumes uniform incoming flow. Ia, actual incoming flow is often skewed. Graded perforation reduces the open area in high-velocity zones. This increases local resistance. It forces some airflow toward low-velocity zones. CFD optimization studies on fixed beds show that a graded layout (sparse at center, dense at edges) plus an inlet guide cone can reduce cross-sectional velocity standard deviation from 0.38 me 0.12. The uniformity index rises to 92%. Kena itinitini, CO oxidation conversion fluctuations narrow from ±8% to ±2%.
Operational Control
Bed resistance distribution changes over time due to dust and catalyst aging. Continuous monitoring of pressure drop and cross-sectional temperature identifies trends before skewing becomes severe. Operators can then adjust the inlet guide angle or the local state of the distribution plate. This requires adjustable flow-control elements in the reactor design. It is better than fixing all flow-conditioning functions rigidly in the initial structure.
How to Diagnose Airflow Distribution Problems
Diagnosis requires cross-checking operational data with physical inspections.
Pressure Drop Signals
Pressure drop across the catalyst bed directly reflects flow resistance distribution. After establishing a stable baseline, a persistent upward trend in pressure drop indicates possible local blockage from dust or catalyst pulverization. This trend matters especially when operating conditions have not changed significantly. Wider pressure fluctuations often signal channeling or maldistribution. Engineering best practices suggest inspecting the bed once initial resistance increases by 30%.
Cross-Sectional Temperature Difference
Non-uniform heat release from CO oxidation creates observable temperature gradients. During steady-state operation, if temperatures at different bed locations consistently deviate beyond design expectations, the reaction load has shifted away from uniform. For adiabatic or near-adiabatic reactors, a cross-sectional temperature difference above 30°C typically requires intervention. Ia, temperature signals often lag behind maldistribution onset. Koya gona, they cannot serve as the only early warning indicator.
Physical Inspections and Flow Field Tests
During a scheduled shutdown, technicians can remove catalyst modules and observe surface conditions. Distinct color zoning generally confirms uneven gas flow distribution. Examples include localized blackening (carbon deposition or sintering) or normal coloration (insufficient reaction). Localized depressions and erosion marks on the upper catalyst surface also indicate maldistribution. Ena gauna ni cakacaka, engineers can establish a grid of velocity measurement points upstream of the catalyst. They calculate the relative standard deviation (RSD) of velocity distribution. An RSD above 15% means the system fails to meet engineering requirements. Combining CFD simulations with cold-flow physical model experiments allows quantitative flow field assessment without a shutdown. Vaka kina, this provides a basis for system modifications.
Why Must CO Catalyst Selection Match Gas Flow Conditions?
The core objective of catalyst selection is to align catalyst activity characteristics with actual reactor gas flow conditions. Laboratory activity evaluations typically use ideal flow distribution and sufficient mass transfer. The resulting conversion rates reflect the upper limit of intrinsic activity. In a real reactor, effective conversion results from both intrinsic activity and gas flow distribution quality.
Space Velocity Selection
The quality of gas flow distribution directly constrains space velocity selection. Pilot-scale data on catalytic CO purification in sintering flue gas show that at 3000 h⁻¹ space velocity and 180–195°C inlet temperature, average CO catalytic efficiency can reach 90%. This figure assumes largely uniform gas flow distribution. Every unit volume of catalyst operates near design space velocity. If uneven flow causes local space velocity in high-velocity zones to reach 1.5 times the average, CO conversion in those zones may fall short of design targets. This happens even when average space velocity remains within the permissible range. Koya gona, when selecting design space velocity, engineers must evaluate achievable flow field uniformity and include a safety margin.
Catalyst Geometry
Catalyst geometry must also match gas flow conditions. Honeycomb catalysts require high inlet velocity uniformity because channels lack lateral mass transfer. Granular catalysts allow limited radial mixing. Ia, beds of small particles tend to agglomerate. Agglomeration can create preferential flow paths (sala). Engineers should select catalyst shape and specifications based on reactor inlet flow characteristics and allowable pressure drop. When inlet flow uniformity is inherently limited, choosing a catalyst structure more tolerant of velocity deviations is often more practical than simply pursuing higher activity.
Ivakamacala: Why CO Catalyst Performance and Airflow Distribution Need Joint Optimization
A CO catalyst achieves its engineering performance under specific gas flow conditions. Catalyst activity determines the theoretical upper limit of reaction rate. Gas flow distribution dictates what proportion of catalyst actually participates in the reaction and how uniformly reaction conditions spread. A mismatch between the two often appears as “catalyst activity meets specifications yet emissions exceed limits” se “catalyst lifespan falls far short of expectations.”
The core of synergistic optimization is treating flow field uniformity as a design variable equal in importance to catalyst activity. This applies during both reactor design and catalyst selection. The goal of inlet structure design is not merely to admit gas. It must ensure velocity distribution meets specific uniformity criteria before gas enters the catalyst bed. Kena itinitini, distribution plate design shifts away from simple geometric symmetry. It moves toward a graded configuration based on the actual incoming velocity profile. Selecting catalyst morphology and loading method requires evaluating actual reactor flow field constraints.
CFD simulations and cold-flow tests play an indispensable role in this collaborative optimization. They enable quantitative prediction of flow field uniformity and corresponding catalyst utilization efficiency before physical construction or catalyst loading. This shifts airflow distribution work from post-operational troubleshooting to design-phase parameter optimization. For systems already in operation, continuous monitoring of cross-sectional temperature and pressure difference trends provides a foundation for process monitoring. It enables early identification of and intervention in maldistribution patterns.
dauvolaivola:Gloria
tikinisiga:2026-09-24
Veivosaki
Vakadidiketaka na nabavuni ni QR ena WeChat